> ## Documentation Index
> Fetch the complete documentation index at: https://openops-ecb4f397-mintlify-helm-chart-documentation-30057.mintlify.site/llms.txt
> Use this file to discover all available pages before exploring further.
# Data Visualization
> How to create and use charts and dashboards in OpenOps Analytics
You can visualize data that you collect with [OpenOps tables](/reporting-analytics/tables/) and display the visualizations in the **Analytics** view in OpenOps.
In addition to OpenOps tables, OpenOps Analytics can connect to and visualize your existing data sources, such as CSV files, Google Sheets, Postgres databases, and more.
## Analytics admin portal
To configure data visualizations, click **Analytics** on the main navigation bar in OpenOps. When the **Analytics** view opens, click **Admin Panel** to proceed to the Analytics admin portal that is separate from the main OpenOps application.
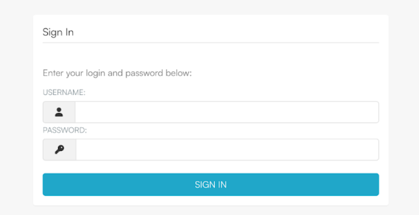 To sign in to the Analytics portal, use `admin` as the username and the password defined with the `OPS_ANALYTICS_ADMIN_PASSWORD` variable in the `.env` file in your OpenOps installation folder. (If you haven’t changed the password, the default is `please-change-this-password-1`.)
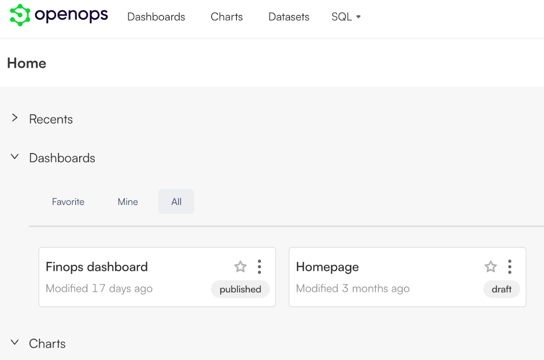
Once you log in, you can see two built-in dashboards: **FinOps** and **Homepage**. Modifying the **FinOps** dashboard will affect the **Analytics** tab in OpenOps.
To sign in to the Analytics portal, use `admin` as the username and the password defined with the `OPS_ANALYTICS_ADMIN_PASSWORD` variable in the `.env` file in your OpenOps installation folder. (If you haven’t changed the password, the default is `please-change-this-password-1`.)
Once you log in, you can see two built-in dashboards: **FinOps** and **Homepage**. Modifying the **FinOps** dashboard will affect the **Analytics** tab in OpenOps.
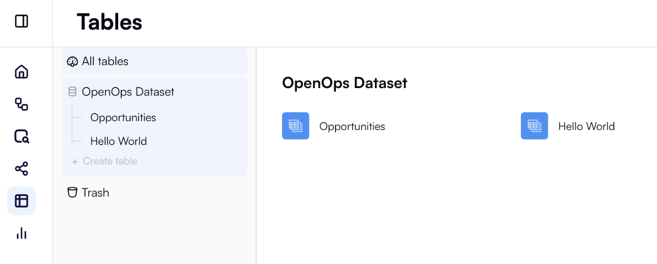
 Behind every OpenOps table, there is a Postgres database view that can be used to build charts and queries.
When a new table is created in [OpenOps tables](/reporting-analytics/tables/), the system automatically creates a new database view with the naming convention *table name \_ table id \_ userfriendly*. You can use this view to create dashboards in OpenOps, as well as connect it to other BI systems.
Behind every OpenOps table, there is a Postgres database view that can be used to build charts and queries.
When a new table is created in [OpenOps tables](/reporting-analytics/tables/), the system automatically creates a new database view with the naming convention *table name \_ table id \_ userfriendly*. You can use this view to create dashboards in OpenOps, as well as connect it to other BI systems.
 ## Building new charts
To configure a new chart to display in the **Analytics** view in OpenOps, do the following:
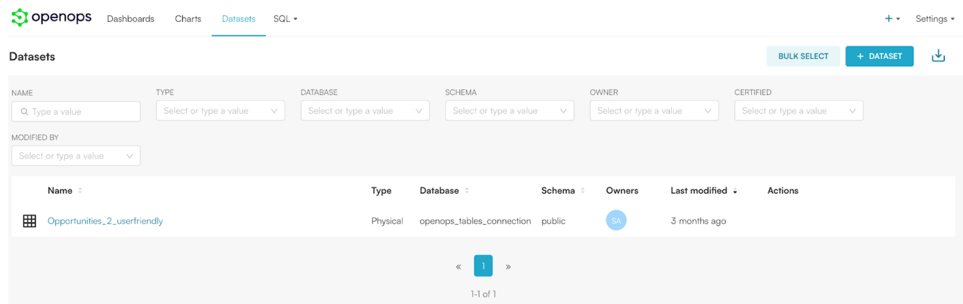
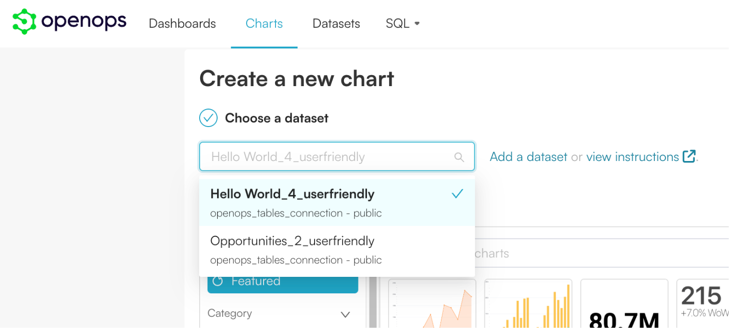
1. Create a new dataset for the OpenOps table that you want to source data from. To do this, navigate to **Datasets** and click **+ Dataset**. This will allow you to create a dataset on top of one of your OpenOps tables:
## Building new charts
To configure a new chart to display in the **Analytics** view in OpenOps, do the following:
1. Create a new dataset for the OpenOps table that you want to source data from. To do this, navigate to **Datasets** and click **+ Dataset**. This will allow you to create a dataset on top of one of your OpenOps tables:
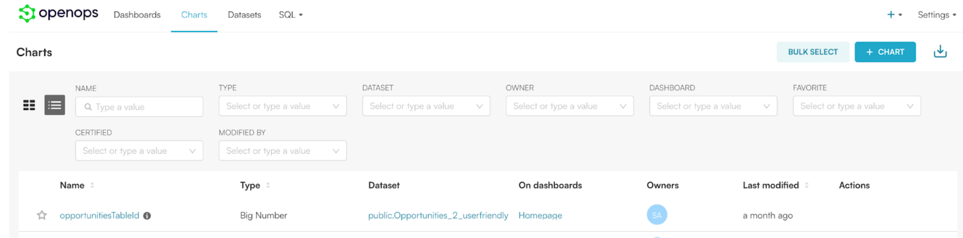
 2. After the dataset has been created, create a new chart by navigating to **Charts** and clicking **+ Chart**:
 3. Configure your chart. Refer to [this Superset documentation page](https://superset.apache.org/docs/using-superset/creating-your-first-dashboard#creating-charts-in-explore-view) if you need help.
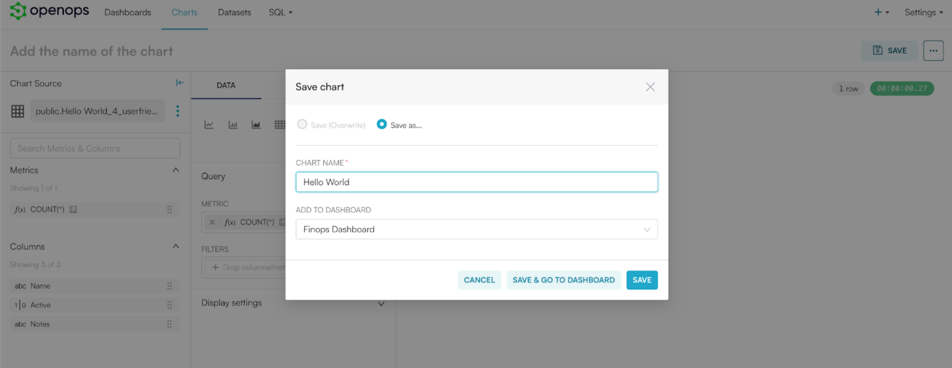
 4. When saving the chart, add it to the **FinOps** dashboard:
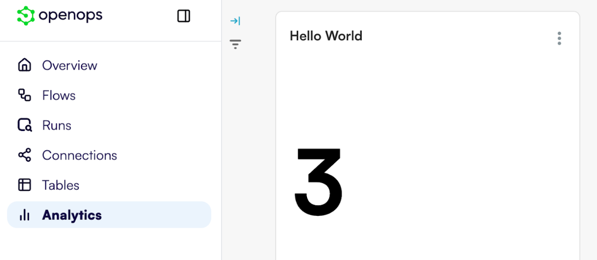
 As a result, the chart will display in the **Analytics** view back in OpenOps:
 For more information on how to create charts, see [Superset documentation](https://superset.apache.org/docs/intro/).
## Connecting to external data sources
Here's what you can do to connect OpenOps Analytics to external data sources such as CSV files:
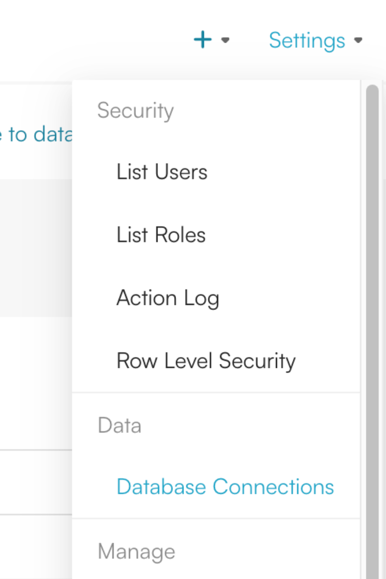
1. In the Analytics admin portal, go to **Settings > Database Connections**.
For more information on how to create charts, see [Superset documentation](https://superset.apache.org/docs/intro/).
## Connecting to external data sources
Here's what you can do to connect OpenOps Analytics to external data sources such as CSV files:
1. In the Analytics admin portal, go to **Settings > Database Connections**.
 2. Click on **+ Database** to connect to an external data source, such as your own Postgres instance or Google Sheets.
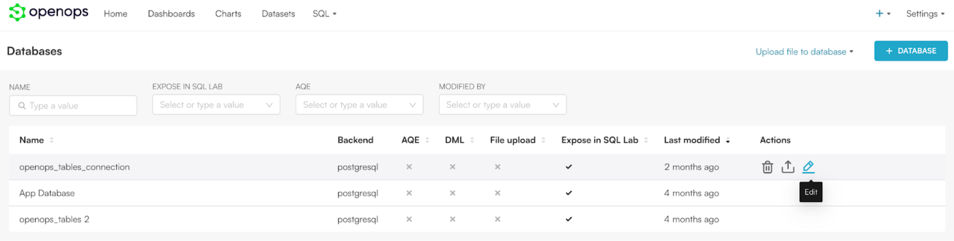
3. Once you have created a database connection, if you’d like to upload CSVs to it, click the **Edit** icon for the database connection:
2. Click on **+ Database** to connect to an external data source, such as your own Postgres instance or Google Sheets.
3. Once you have created a database connection, if you’d like to upload CSVs to it, click the **Edit** icon for the database connection:
 4. In the popup that displays, go to **Advanced > Security**, scroll down, and enable **Allow file uploads**.
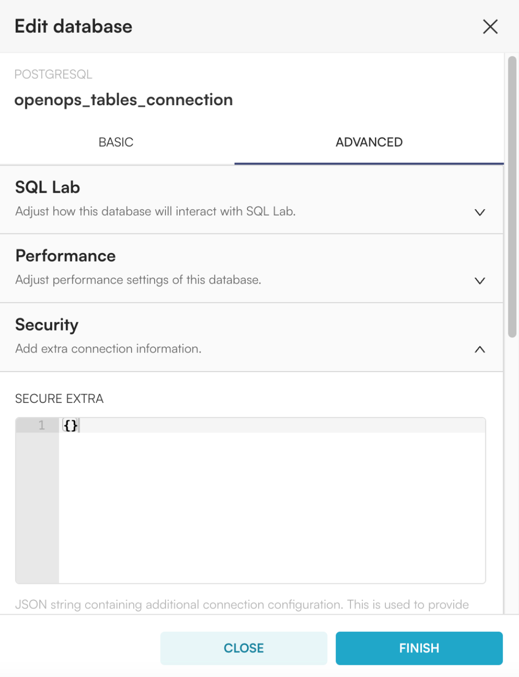
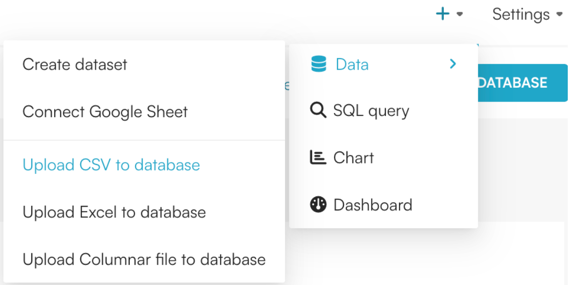
 5. Click **Finish**. As a result, you should now be able to upload CSV files into your database:
 You can now build charts based on the data from your external data source, similar to how you do it with OpenOps tables. When you add charts to the **FinOps** dashboard, they become available in the **Analytics** view in OpenOps.
Feel free to join our [Slack community](https://slack.openops.com) if you have any questions or need help with your installation.
You can now build charts based on the data from your external data source, similar to how you do it with OpenOps tables. When you add charts to the **FinOps** dashboard, they become available in the **Analytics** view in OpenOps.
Feel free to join our [Slack community](https://slack.openops.com) if you have any questions or need help with your installation.